As the internet has evolved to support more web-ready devices, the way users interact with the internet has changed. More users are connecting via different platforms than ever before, and as a business it is important to understand where connections are coming from.
It’s easy to assume that desktop and mobile account for the biggest chunk of internet users, but there are other platforms to consider, and the numbers behind what platforms are being used may help you to form important business decisions.
Internet Percentages
Nielsen recently did a study to analyze certain stats about internet usage across various types of devices. One of the major areas that the study looked at was video and movie streaming. Considering places like Netflix and Hulu make up a very large portion of the entire internet traffic, looking at device usage stats on these platforms can give you an idea about what people are using.
Netflix and Hulu are also supported by many internet connected devices, so this gives us a better picture of where users are connecting to the internet from. The largest percent of Netflix and Hulu users were shown to have connected via PC, with 44% and 43% going towards Netflix and Hulu respectively.
Quite a long way behind PC was mobile phones, or smart phones, with 23% and 17% of traffic. Tablets made up for another 14 and 15%, which would give the overall ‘mobile’ category around 30% of the entire Netflix and Hulu traffic. We already know that mobile phone traffic is greater than ever, but it seems the Tablet is inching closer and closer.

Interestingly, both the Xbox 360 and PS3 took between 10% and 16% across both platforms, and smart TVs also took between 14% and 17% of traffic. The Wii had a strangely large 21% for Hulu, and 13% for Netflix. Finally, internet connected Blu-ray players and TV-connected computers accounted for between 13% and 17% each, across both platforms.
It’s clear that internet usage patterns would change depending on what websites or online content is being accessed, and we can take a look at other studies to confirm this. In a similar Nielsen study, monthly social media time was reported to be 6 hours and 24 minutes via a PC or laptop for Facebook. Tablet Facebook usage was at 7 hours and 43 minutes for Facebook, whilst smartphone users only visited Facebook for around 40 minutes per month.
Tablet devices also took the most Twitter time with 3 hours, 7 minutes, whilst PC took just 36 minutes per month, and smartphones took 11 minutes per month.
The Results
What this data shows is that many people use their devices for different situations and every business needs a website that will adapt to these different situations automatically. It is possible that many of the same people who browse Twitter and Facebook for so long on their tablet also fit into the same group that use desktop to view Netflix.
Many devices are used for different scenarios, and even smart TVs and game consoles are now more internet connected than ever before. As a business owner who may be looking to get up to speed online, it’s very important to understand the wide variety of devices that connect to the internet on a daily basis.
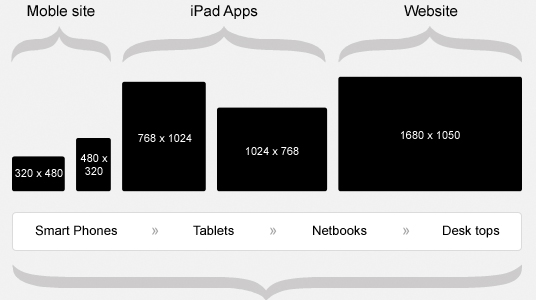
Because of the range of devices from smartphones to smart TVs, it’s hard to provide for all of these devices simultaneously. The solution that can save money, effort and time is to look into finding a responsive website design for your business’ web page. A responsive web design will adapt automatically, according to the screen size of the device it is being displayed on.
If you’re looking for a new website, and are looking for experts who are familiar with all devices, Click Here to contact us!